We have expanded our Spectrum system into a full DOT fNIRS solution, delivering complete hardware and software functionality for diffuse optical tomography. As part of the Cortivision ecosystem, Spectrum DOT complements our existing technologies and provides researchers with a comprehensive imaging tool. With this addition, Cortivision offers scientists an integrated platform that supports advanced brain research with precision, flexibility, and ease of use.
What Makes Spectrum DOT Unique?
One system for traditional fNIRS and DOT
You don't have to choose between traditional fNIRS and DOT, because you can change your mind later. Our SPECTRUM C23 allows you to place emitters and detectors closer or further from each other, depending on whether you want to perform traditional or high-density fNIRS.
Choose the right cap for your needs.
We developed our own custom caps system that you can adjust to the regions of the brain you wish to record using DOT. Those can be ordered and delivered ready for use.
However, you can still use our standard fabric caps for traditional fNIRS.
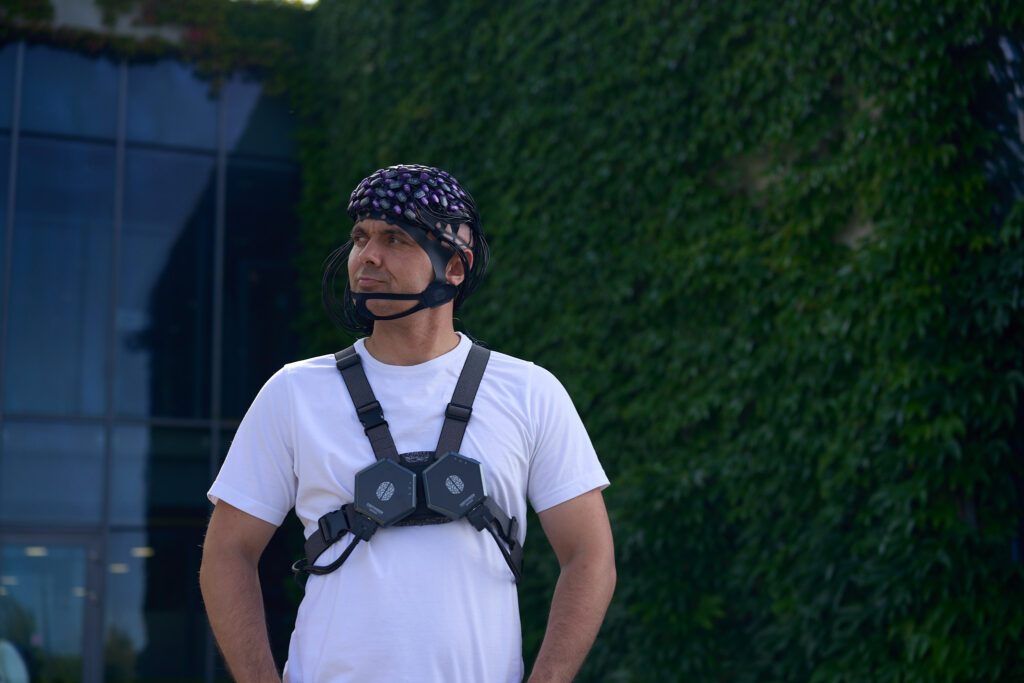
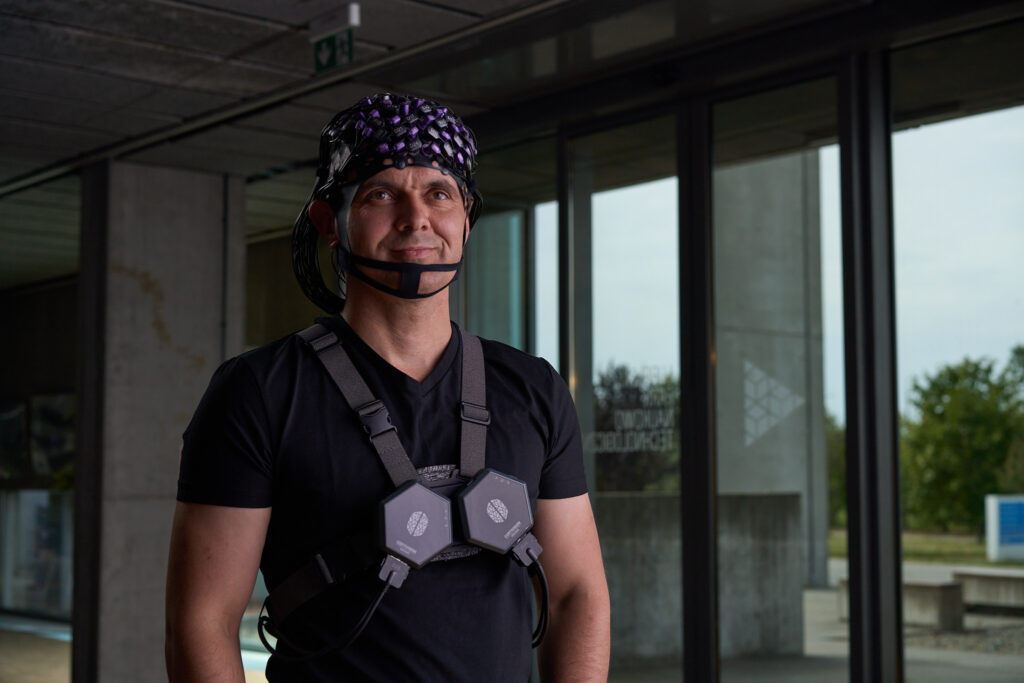
Truly mobile DOT
Despite the large number of emitters and detectors, our system is still suitable for mobile applications outside the lab.
Seamless hardware & software integration
DOT with Cortivision is not just hardware. Our system comes with dedicated software that supports setup, calibration, and advanced reconstruction. This all-in-one solution ensures that researchers can start experiments quickly and obtain high-quality tomographic data without needing additional third-party tools.
What is DOT?
Diffuse optical tomography (DOT) is a functional near-infrared spectroscopy (fNIRS) technique that utilizes a high-density array of sources and detectors to estimate 3D images of the hemodynamic response in the cortex. Traditional fNIRS is a powerful and portable tool, but its limitations in spatial resolution and depth specificity can be a challenge. High-density DOT addresses these shortcomings by offering the accessibility of fNIRS with the spatial insight provided by fMRI.
Spatial Resolution
Channel count: 314
DOT fNIRS: DOT, with its high-density array of overlapping channels, can produce images with a spatial resolution approaching that of functional MRI (fMRI), allowing for a more accurate localization of brain activity. This is particularly useful for differentiating between closely located brain regions.
Channel count: 40
Traditional fNIRS: Traditional fNIRS uses a limited number of source-detector pairs, which can result in lower spatial resolution and a lack of detail.
Sensitivity and signal quality
DOT fNIRS produces a cleaner, more specific signal from the cerebral cortex. This reduces the risk of misinterpreting scalp blood flow changes as brain activity, leading to more robust and trustworthy research results.
A limitation of traditional fNIRS is that it’s highly sensitive to signals from the scalp and superficial tissue, making it difficult to isolate the true cortical response.
Image reconstruction
DOT fNIRS provides a 3D image of the brain’s functional hemodynamics. This volumetric data enables a more comprehensive understanding of brain function, allowing for the analysis of specific anatomical regions of interest.
Data from traditional fNIRS are mostly analyzed channel-by-channel, and the visualizations on brain models are mainly based on a simple projection of 2D maps onto a 3D model, which has low explanatory value.
Explore our complete fNIRS DOT research environment
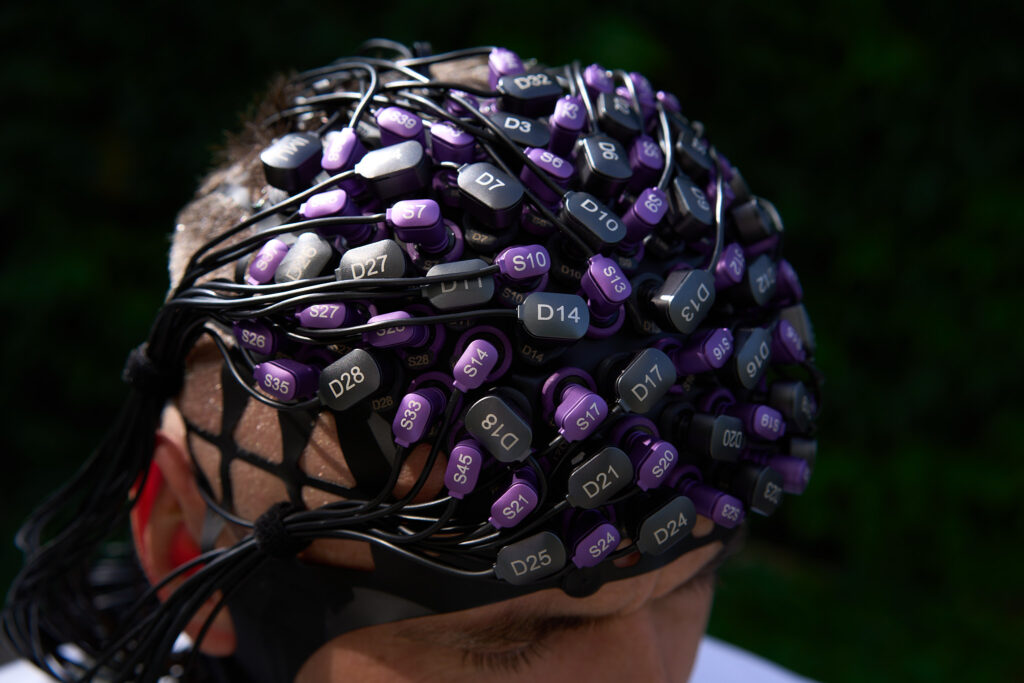
Clarity of montage
Individually configured fNIRS caps with labeled holders and optodes ensure precise organization and facilitate efficient experimental setup.
Next-generation fNIRS DOT design — mobile, comfortable, and intuitively organized for seamless research workflows
Next-generation fNIRS DOT design — mobile, comfortable, and intuitively organized for seamless research workflows
Clarity of montage
Individually configured fNIRS caps with labeled holders and optodes ensure precise organization and facilitate efficient experimental setup.
Create your high-density fNIRS workflow in a few easy steps