Data Quality
Finger Tapping
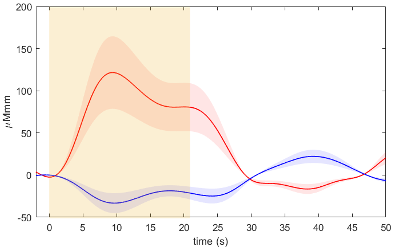
Finger Tapping Task is commonly used in validation studies of fNIRS temporal resolution (Drenckhahn et al., 2015).
This example shows a simple single-subject finger tapping experiment, where the participant was asked to perform finger-to-thumb movements with the right hand as fast as possible. The subject was asked to perform the following sequence:
2 — 3 — 4 — 5 — 5 — 4 — 3 — 2, where
2 – index finger,
3 – middle finger,
4 – ring finger,
5 – little finger.
There were 8 repetitions of the task with 20 seconds of the task itself and 43 seconds of rest periods between them. This is a measurement for a single channel localized between C3 (source) and CP3 (detector) optode positions.

Motor Imagery
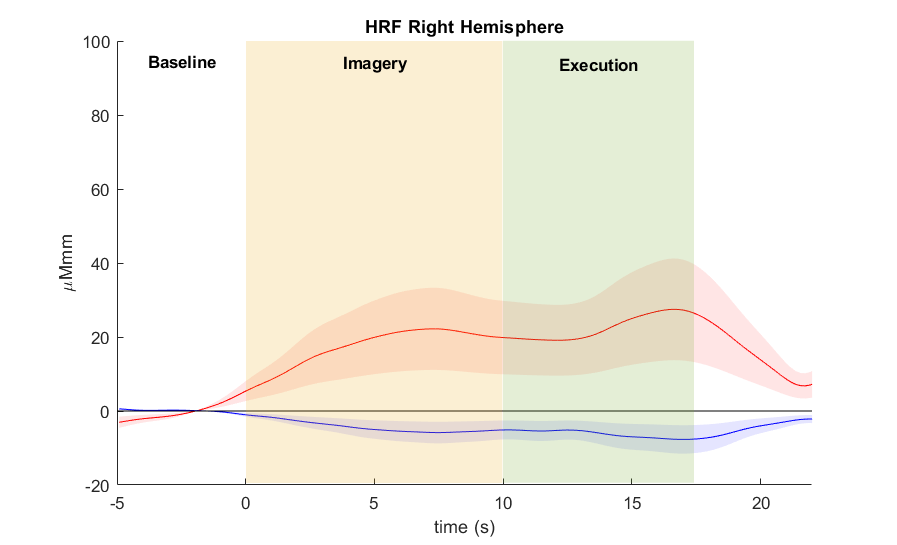
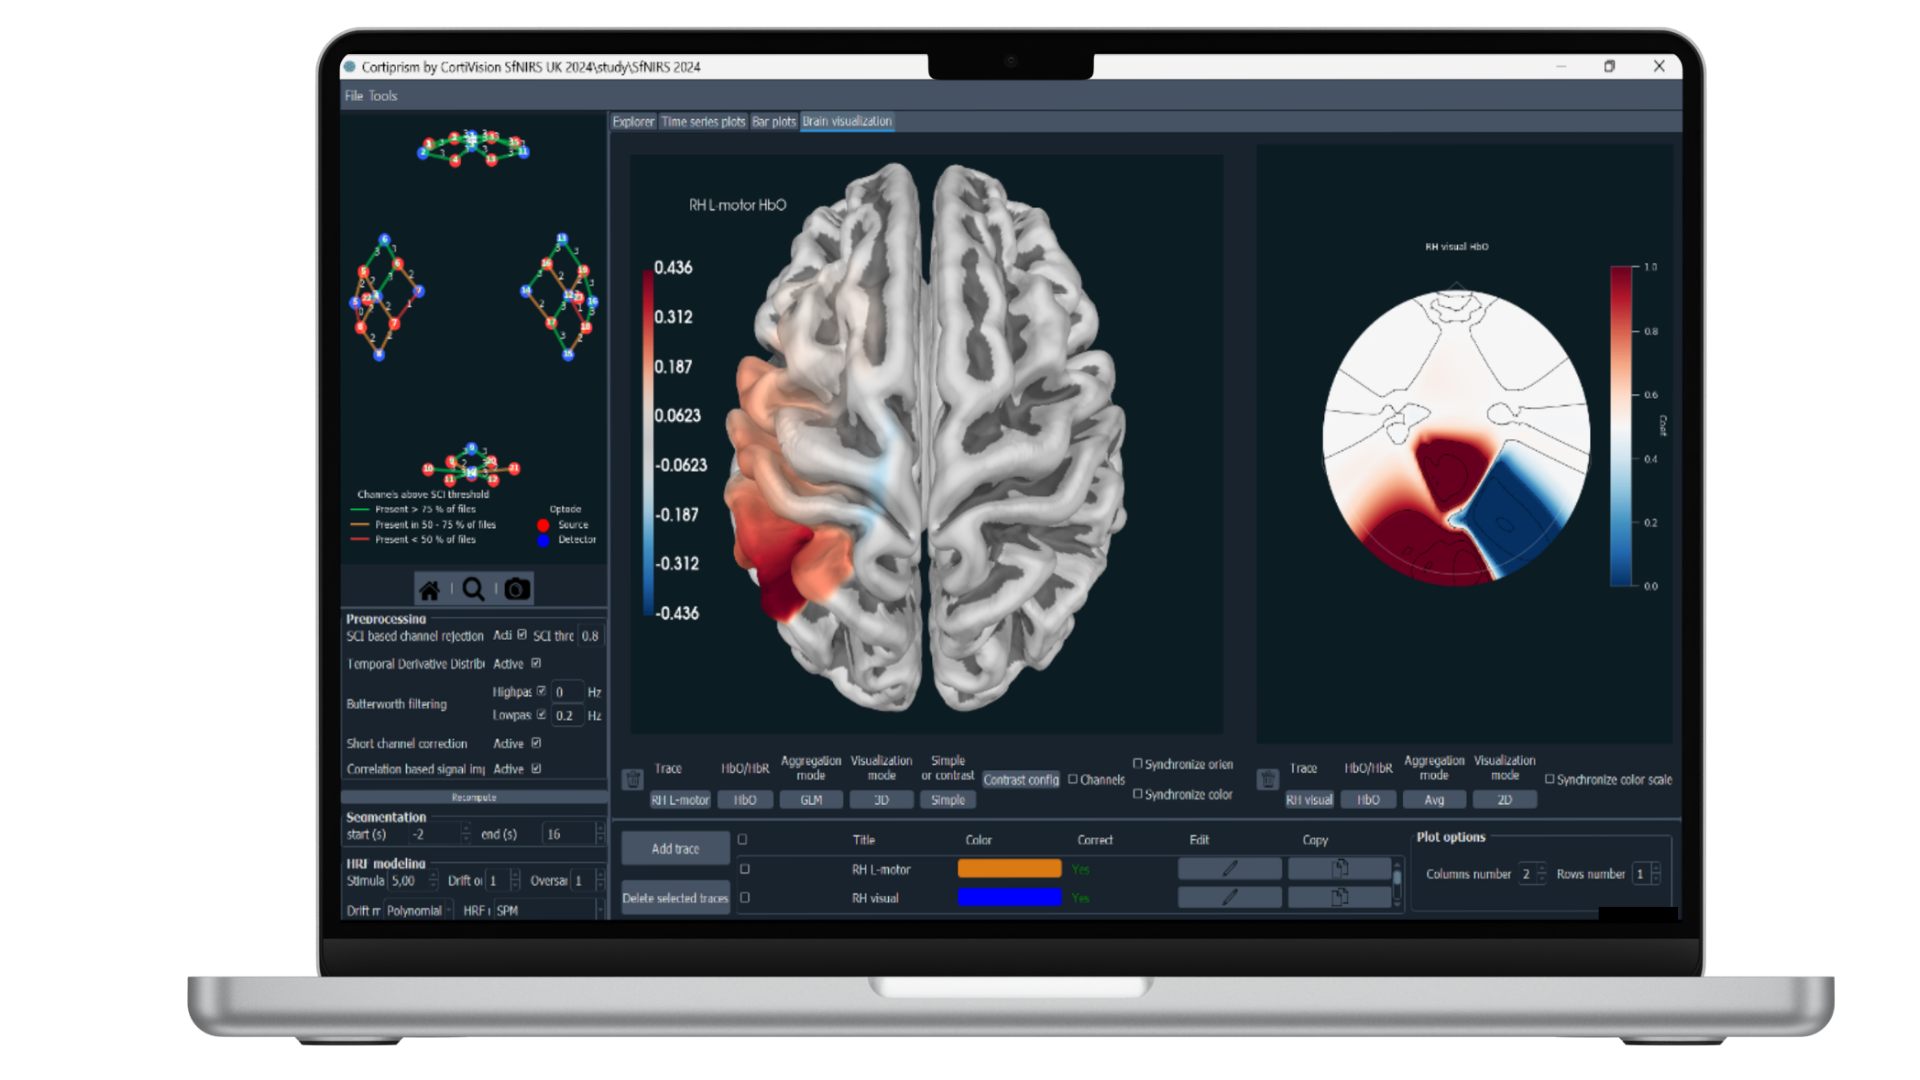
Motor imagery is defined as the mental simulation of a movement without any real action. Mental representation of a right hand movement evokes higher activation of motor cortex areas located on the opposite side of the head (contralateral) and lower activation of areas located on the same side (ipsilateral) (Fig. 3.). In the case of the BOLD response measured by fNIRS, greater activation corresponds to increased oxyhemoglobin levels and a decrease in deoxyhemoglobin levels. Our study results present a difference in the motor cortex activations registered in both hemispheres during imagined and real right-hand movement (Fig. 4.).

Signal quality during motion conditions
The notable advantage of fNIRS technology is its increased resistance to environmental artifacts compared to other brain recording methods. However, movements of the entire body, specific body parts (such as head movements), or shifts of the optodes on the scalp during recording can still affect signal quality.
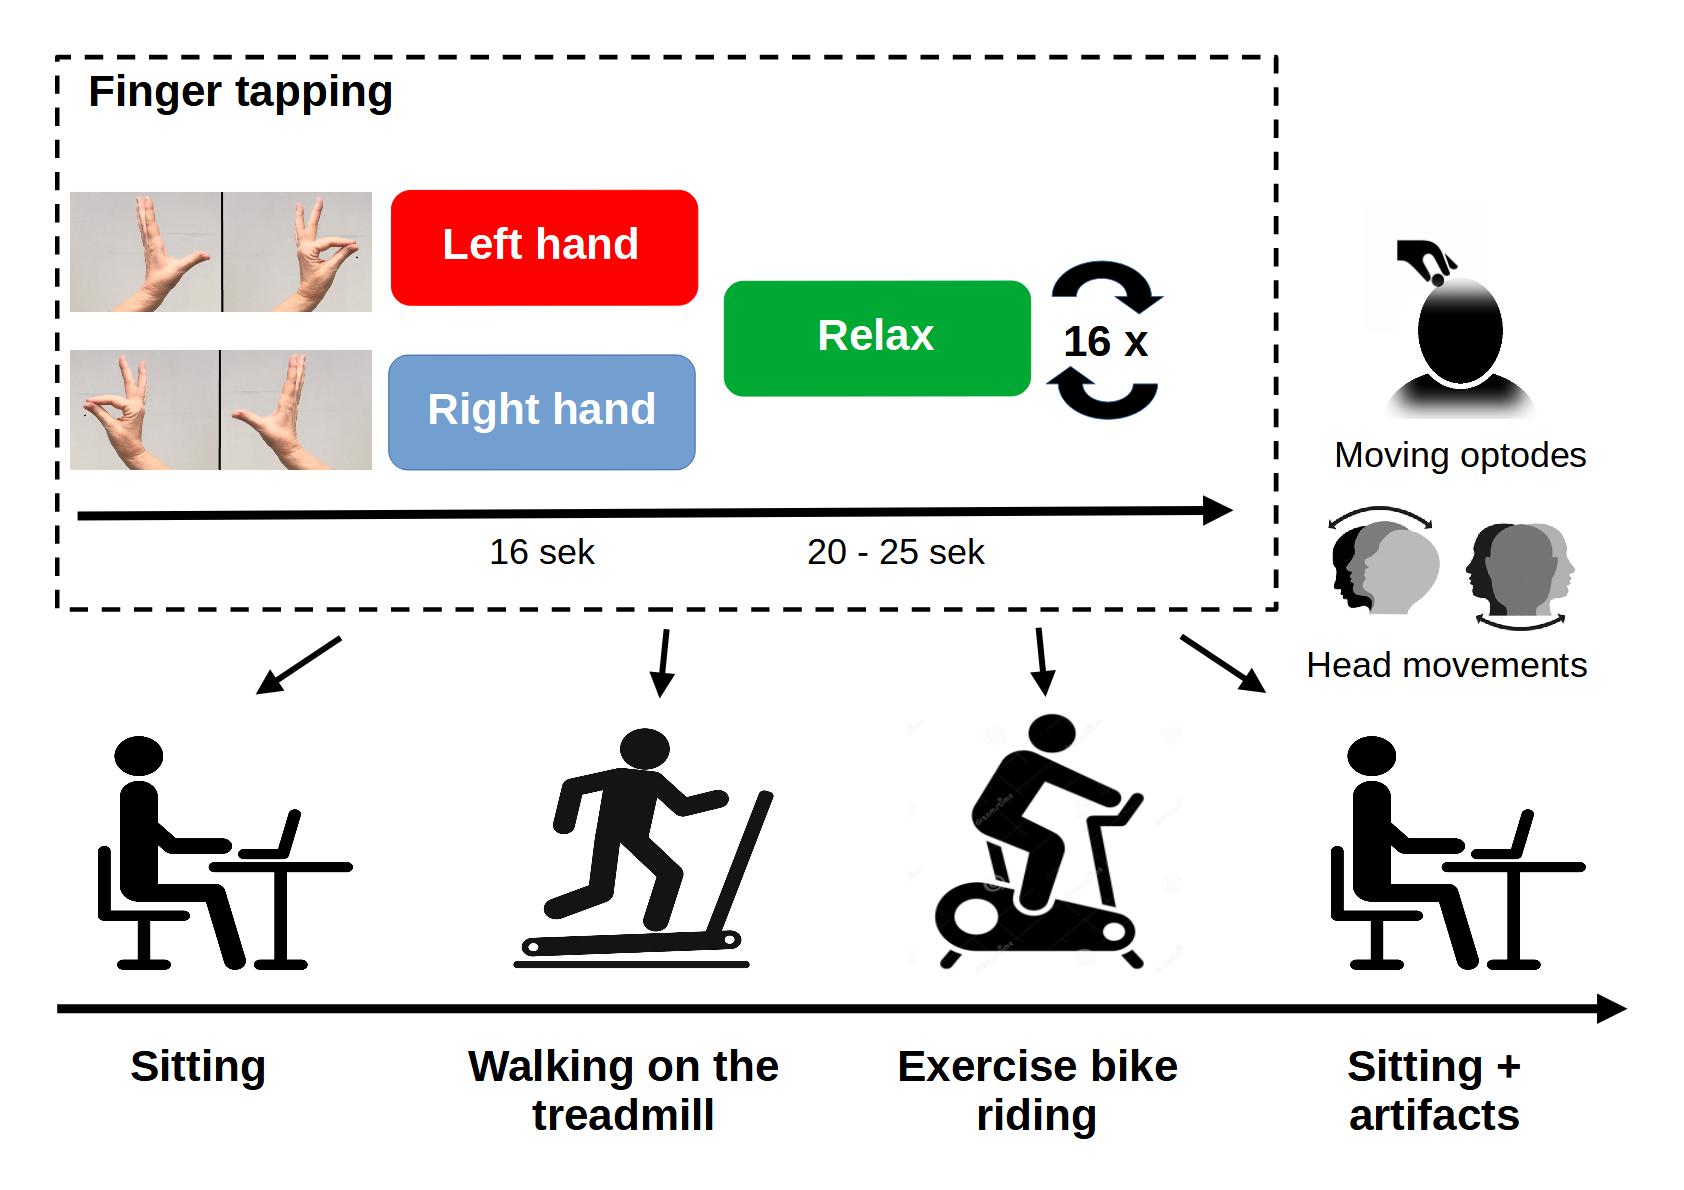
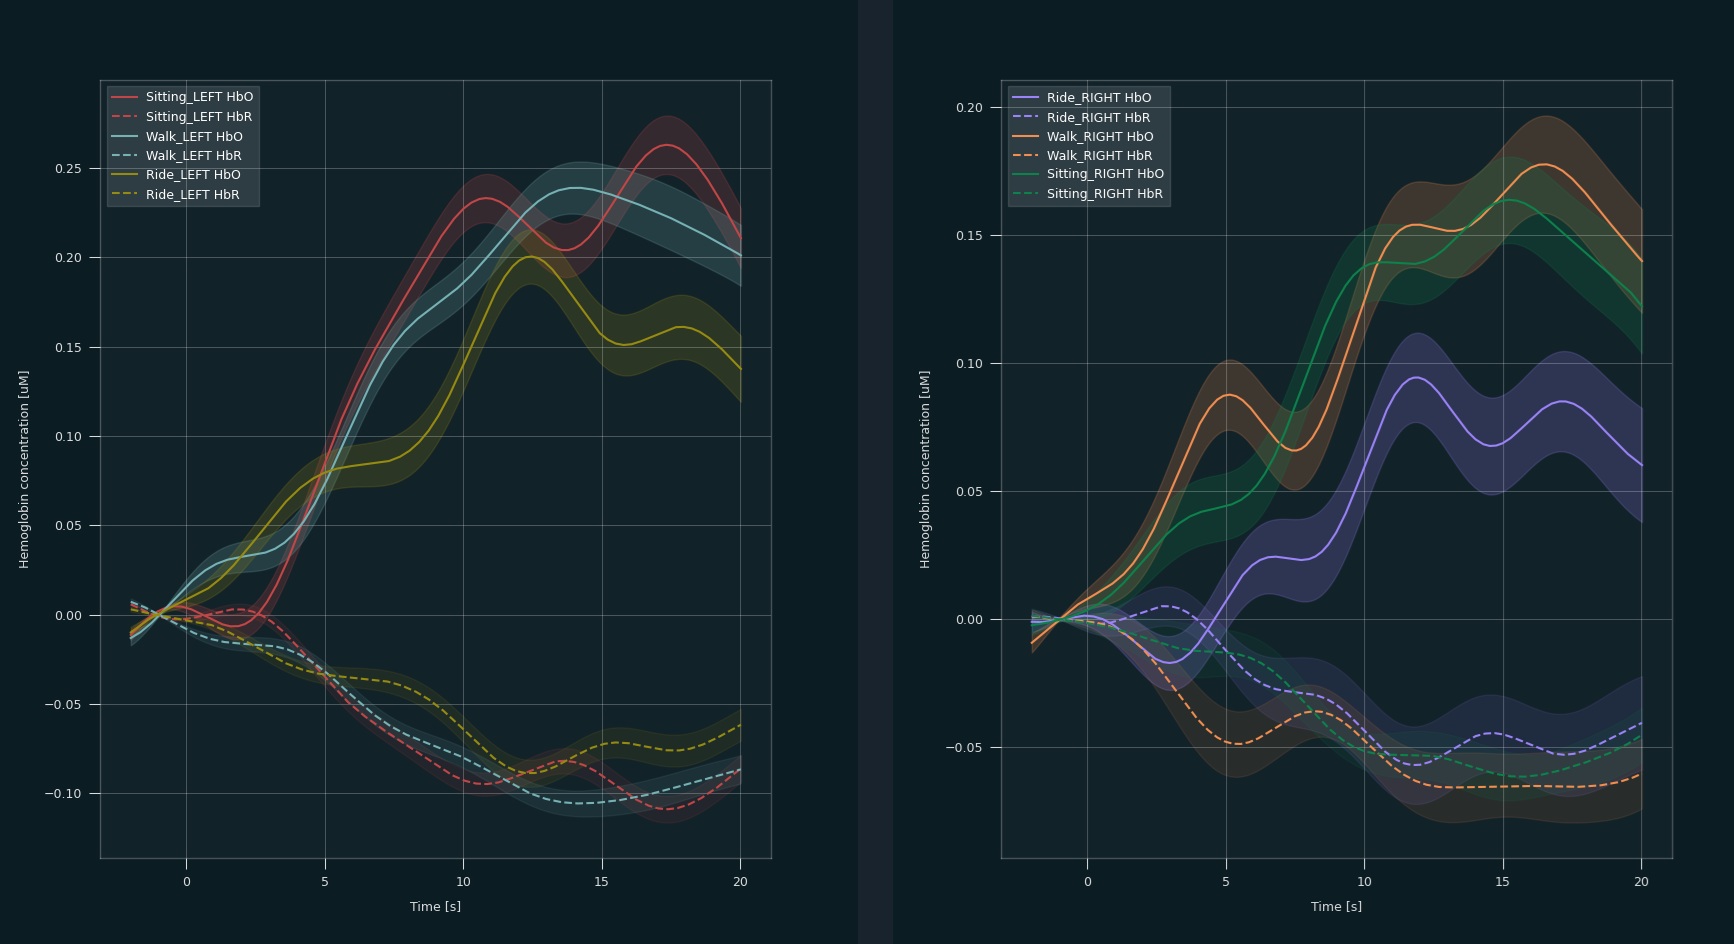
To demonstrate the impact of these factors on data quality, we conducted a study (n = 10) involving finger-tapping and relaxation sequences under four different experimental conditions:
- sitting;
- walking on a treadmill;
- riding an exercise bike; and
- sitting with shifting optodes and significant head movements.
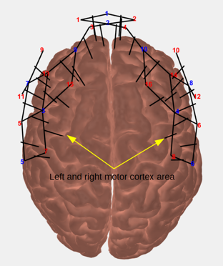
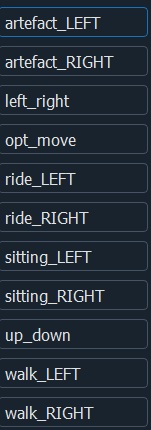
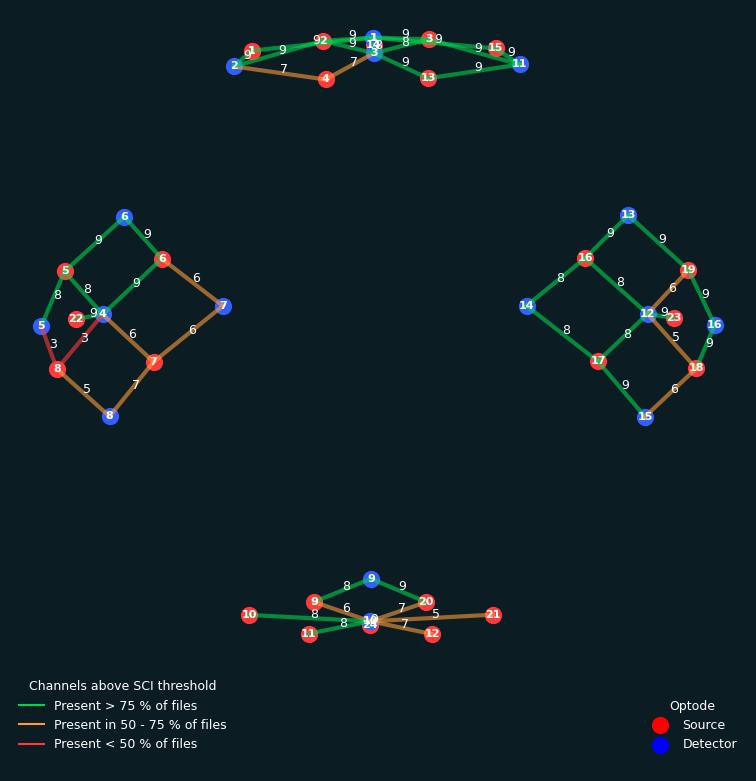
The folder in BIDS (Brain Imaging Data Structure) format contains .snirf files from a group of 10 participants involved in the experiment. The markers indicate the moments when artifacts occurred in the signal, as well as the experimental conditions (see Fig. 7). During the experiment, data were collected from 50 channels, which included 4 short channels, distributed bilaterally over the motor cortex, as well as in the frontal and occipital regions (see Fig. 8).
Sample Raw Data from Motion Conditions

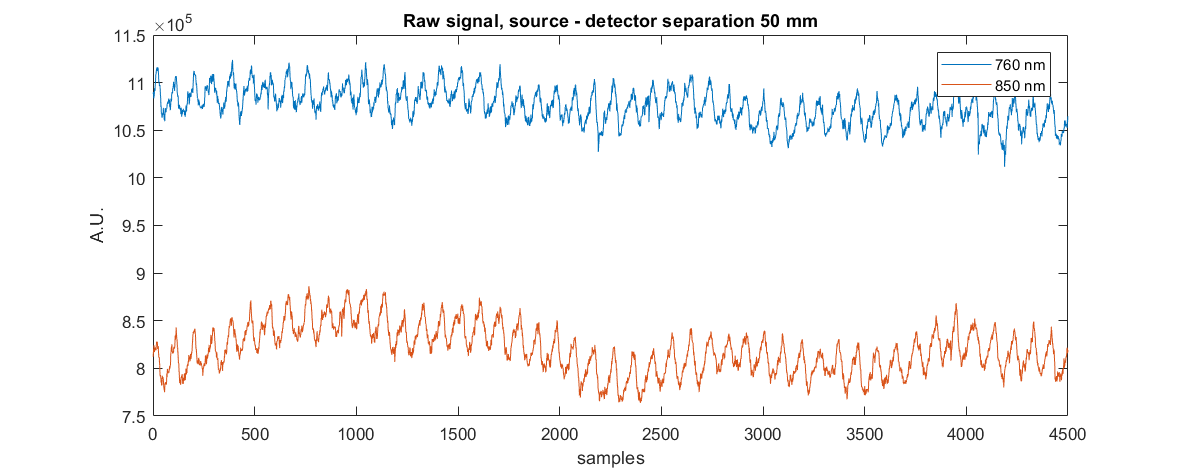
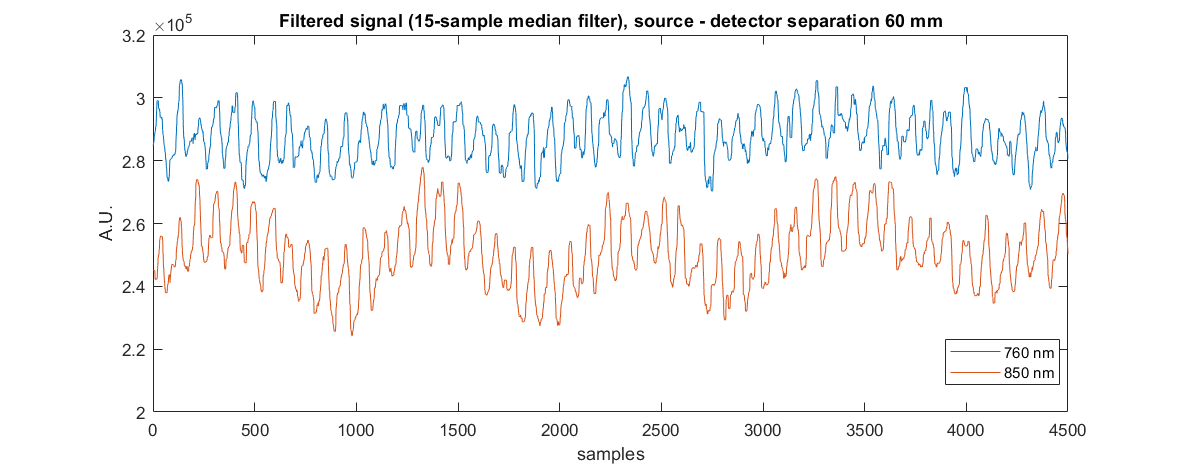
SIGNAL QUALITY AND DATA SAMPLES
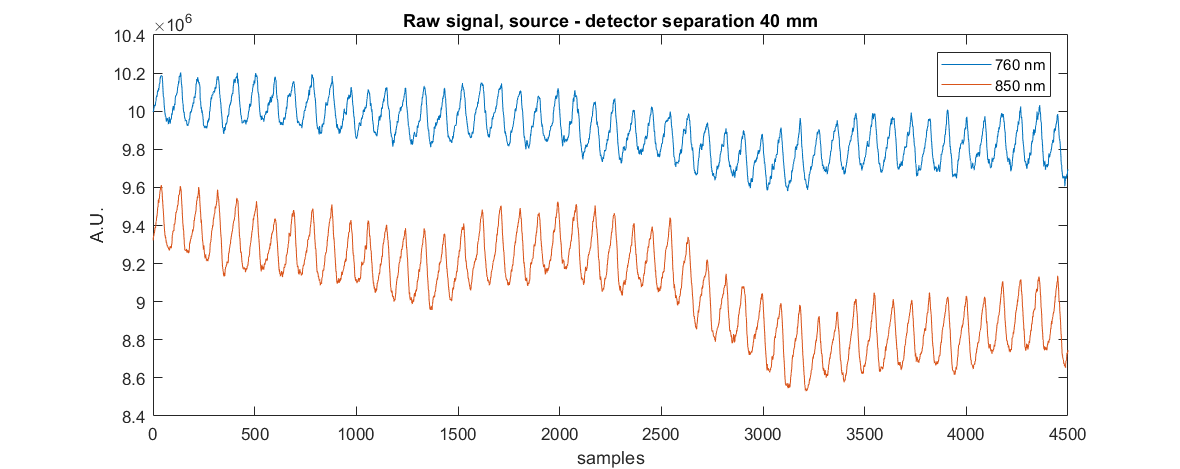
Source-detector separation distances for up to 60 mm

